Operational Control for Hotel Kitchens

Predictable guest experiences require predictable operations. Navitas gives hotel operators real-time visibility and control across every kitchen

Predictable Guest Stays Require Predictable Operations

Guests expect the same experience every time they stay at your hotel. But behind the scenes, maintaining consistent operational standards across kitchens, shifts, and properties is difficult

Brand Risk

Small operational failures can quickly impact guest experience and reputation

Manual Processes

Paper logs and spreadsheets create blind spots in operations

Operational Variability

Different teams, shifts, and kitchens create inconsistent standards

Limited Oversight

Operations leaders lack real-time visibility across multiple properties

Navitas Provides Operational Control

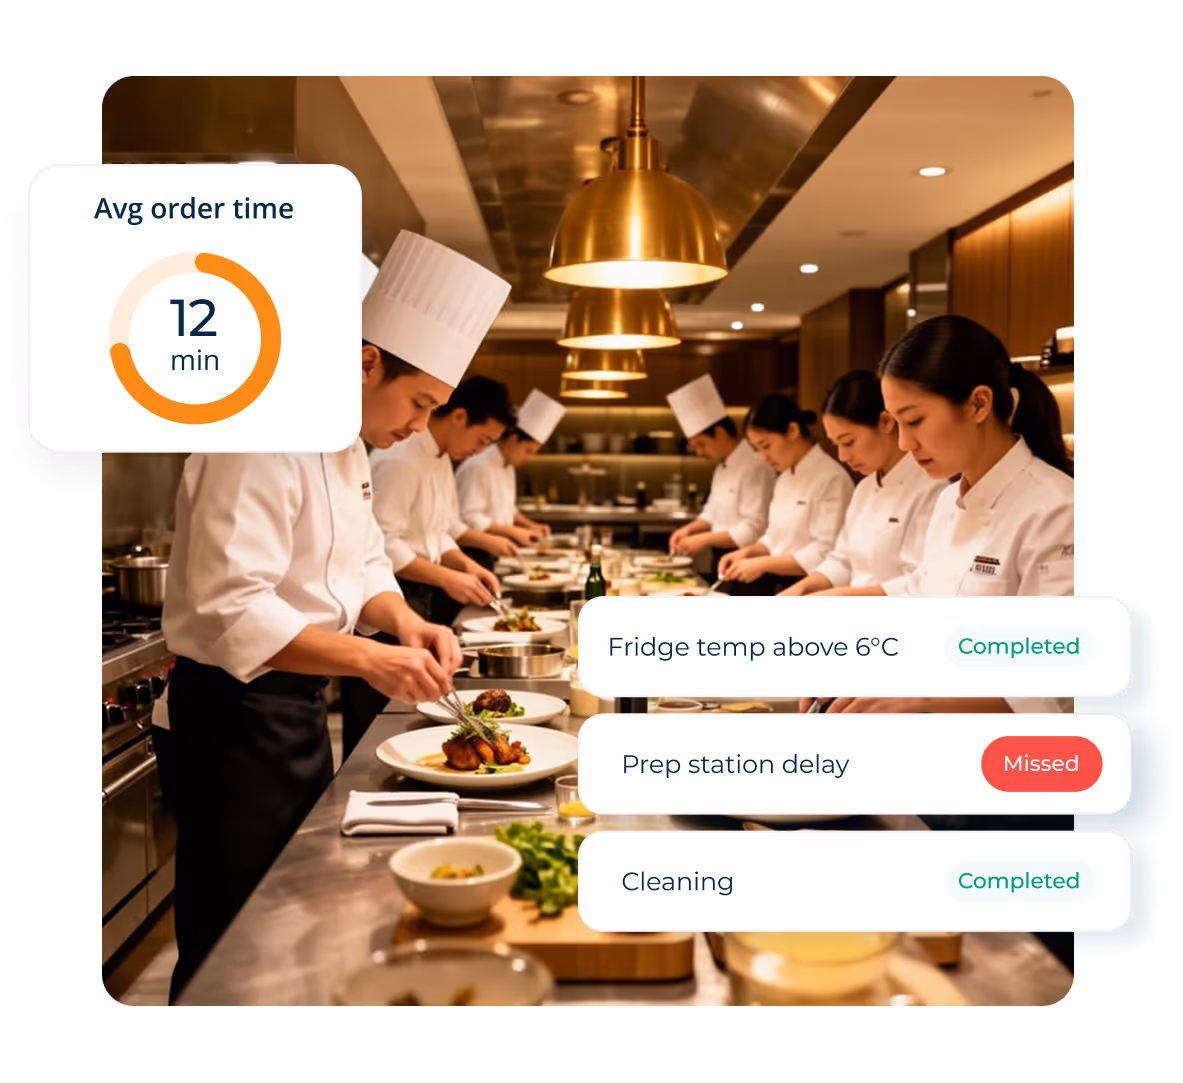
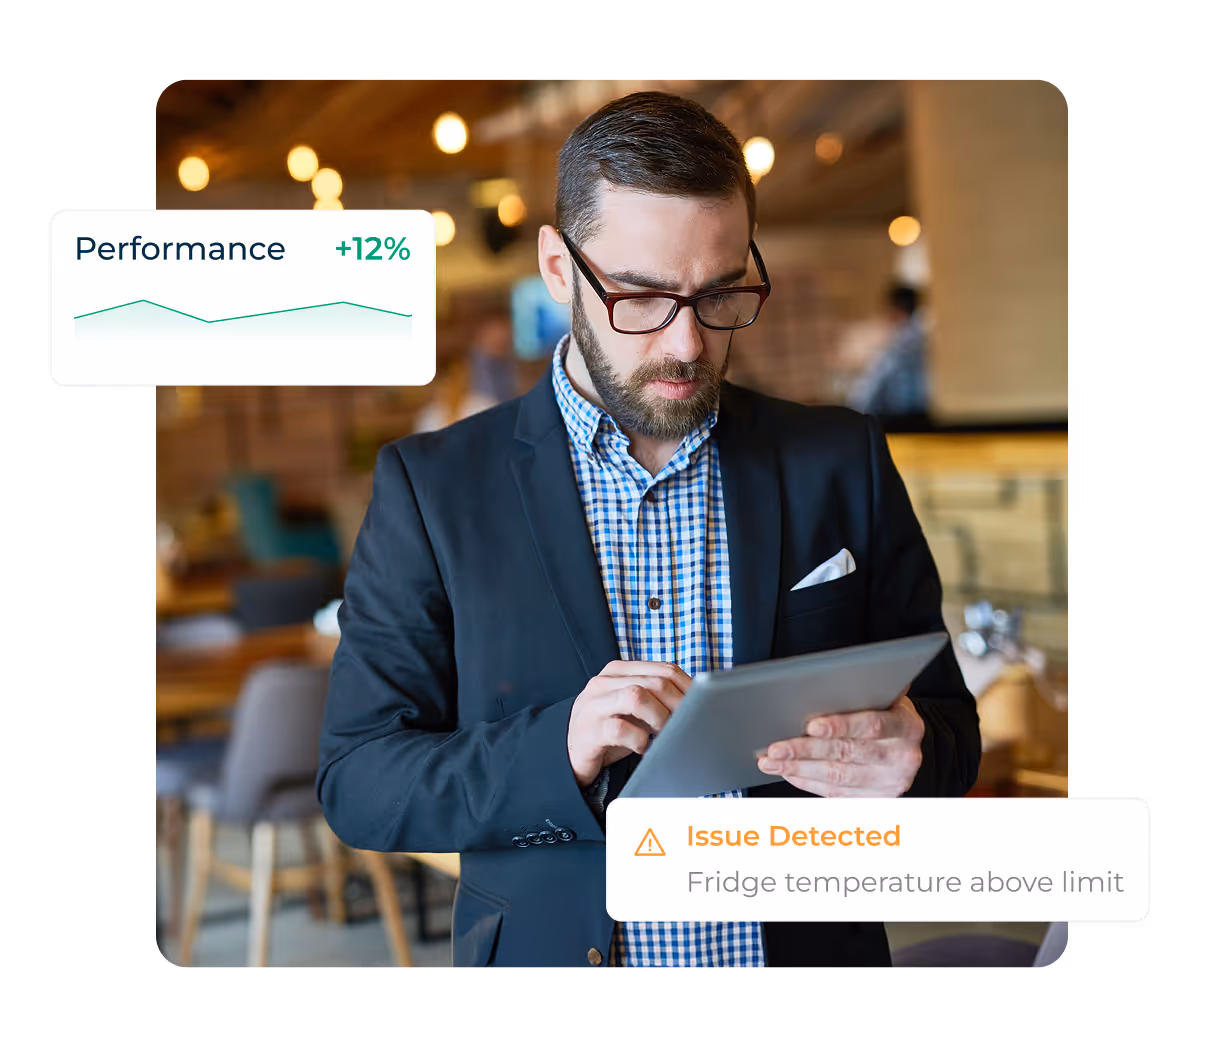
Real-Time Operational

See what is happening in kitchens across every property

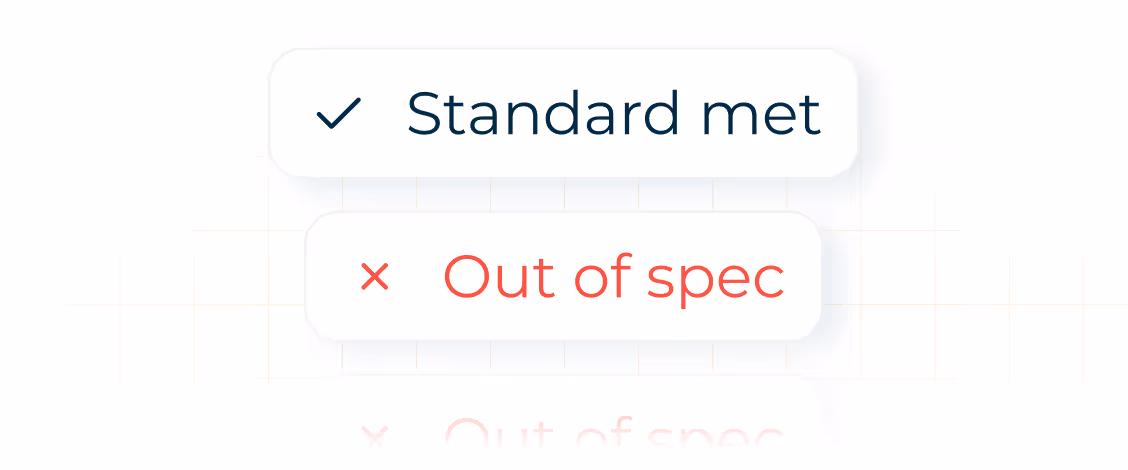
Structured Operational Processes

Standardise operational checks and procedures

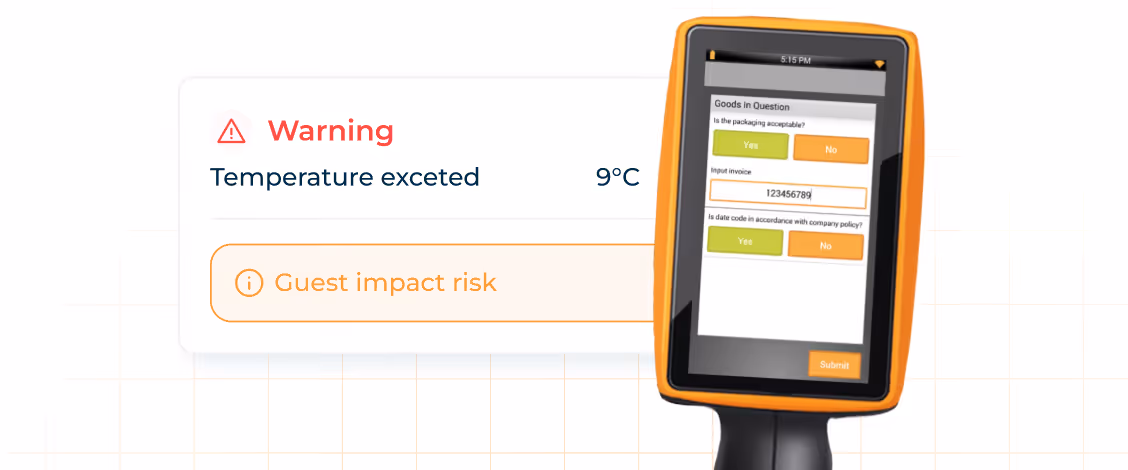
Automated Data Capture

Replace manual logging with digital systems

Operational Action Tracking

Ensure issues are resolved quickly
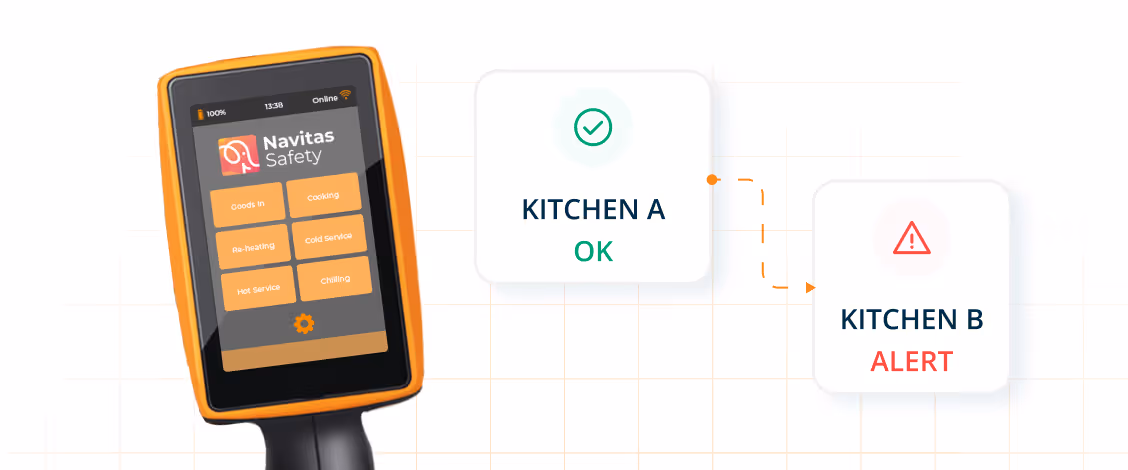
Estate-Wide Insight

Identify operational patterns across multiple properties

Guest Experience Protection

Consistent operational standards protect brand reputation

Designed for Hotel Operations Teams

Operations Directors

Responsible for operational consistency across properties

General Managers

Responsible for delivering predictable guest experiences

Food & Beverage Directors

Responsible for kitchen performance

Executive Chefs

Responsible for kitchen operational discipline

If your organisation operates multiple properties, operational visibility becomes essential

Operational ROI

Calculate the Operational ROI

Software + Hardware
Software Only
£
Failed to fetch value
£
Failed to fetch value
£
min
min
Pod Rate
Failed to fetch value
Hub Rate
Failed to fetch value
Probe Rate
Failed to fetch value
£
Failed to fetch value
Software Cost: /mo
Total Solution Cost: /mo (software + hardware)
Complete all fields to see results
Fill in the values on the left and your ROI calculation will appear here.
Annual ROI
Total savings minus solution cost
Net Profit
Annual Time Savings
Hours Freed
Total Annual Savings
Before solution cost
Gross Savings
Monthly Net Benefit
Pays for itself from month 1
Cash Positive
ROI Multiple — return per £1 spent
Pays for itself from Day 1
Annual cost: vs savings:
Compliance time freed (hardware only) + paper/print/storage eliminated
Staff Time (Mo)
Staff Time (Yr)
Paper & Storage (Mo)
Paper & Storage (Yr)
6% operational efficiency + food waste prevention — scales with number of sites
Efficiency (Mo)
Efficiency (Yr)
Waste Prevention (Mo)
Waste Prevention (Yr)
Annual Cost
Annual Savings
Energy Savings (Yr)
Fridge/freezer optimization
Incident Response (Yr)
Avoided incidents & fines
Carbon Reduction
tCO₂e saved per year
ROI Multiple
Return per £1 spent
Assumptions & Sources
  • Daily Time Savings: 170 min/site/day from digital automation of core tasks — temperature monitoring (60→0 min, includes legally required twice-daily checks), cooking logs (45→15 min), pest checks (15→5 min), record keeping (30→5 min), corrective actions (60→15 min). Based on actual Navitas customer implementations.
  • Audit Savings: Internal audits: 5 hr manual including report writing → 3 hr with digital (2 hr saved). External audit prep completely eliminated (2 hr saved per audit). Included in staff cost calculations.
  • Staff Rate: £13.85/hr UK hospitality average including benefits (ONS 2024: £13.50–14.20/hr).
  • Operational Efficiency: 6% operational efficiency improvement from digital systems (McKinsey 2023). Time freed from automated compliance allows staff to focus on revenue-generating activities.
  • Food Safety Incidents: 3 incidents/site/year (UK hospitality average), saving 3.75 hrs each (4 hrs manual → 15 min per Navitas case study).
  • Energy Savings: 22% energy waste from over-cooling prevented (2.2°C below optimal). Using 833 kWh/year per fridge unit at market rate. Real Navitas customer data.
  • Food Waste Prevention: Temperature failures prevented through automated monitoring reduce waste by ~0.35% of monthly revenue.
  • Carbon Impact: UK electricity grid factor: 0.233 kg CO₂e/kWh (2024).
  • Paper & Storage: £30/site/month in printing, paper, filing, and compliance admin materials eliminated by going digital.
This calculator uses real Navitas customer data and proven results. Values are based on actual implementations across hospitality, stadium, and care home operations. Individual results may vary based on current processes and system adoption.

See Operational Control in Action

Step 1

Operations Dashboard

Operations dashboard walkthrough
Step 2

Kitchen Workflows

Kitchen workflow demonstration
Step 3

Multi-Property Reporting

Multi-property operational reporting

Source One Pilot Programme

Navitas is currently being piloted across hotels within the Source One network in the United States.

The Grand Metropolitan 

New York, NY

This platform gave us real visibility into what was happening in our kitchens.

Coastal Resort & Spa 

Miami, FL

Brand consistency across all F&B outlets became measurable for the first time.

Evergreen Assisted Living

Denver, CO

The temperature probes alone saved us hours every week.

Golden Oaks Senior Residence

Nashville, TN

We finally have visibility across all our kitchens from one dashboard.

Lakeside Care Home

Minneapolis, MN

Installation was seamless and staff adopted the system within days.

System Configuration

Step 1

Digital Log Completion

Kitchen staff completing digital logs

Step 2

Dashboard Overview

Operations leader reviewing dashboard

Step 3

Installation & Onboarding

Installation and onboarding overview

Built for Hospitality Operations

Helping hospitality operators maintain operational control across their kitchens